

In Part One, I introduced a spreadsheet I used AI to build to model retirement income, and my idea to use it as a basis to build a simple, easy-to-use, web-based modeling tool. In this article, I’ll tell you more about the tool and how I built it using AI. I’ll also tell you how to access it and run your own numbers if you’re interested.
Most of this article is a little “nerdy,” so if you’re not really interested in how the sausage was made and just want to taste it, you can jump down to the end of the article where I’ll share links to the tool and instructions so you can jump right in and use it.
Basic architecture
When working with AI, my role is a business analyst who’s working with an IT developer to build the technology solution I wanted. I decided the requirements, both functional and non-functional. The developer (AI) told me what it could not do, and we went from there.
I wanted a relatively simple architecture, so the solution was a single HTML file with embedded JavaScript that replicates the spreadsheet’s calculation engine, which I could then embed on a WordPress page via an iframe. I wanted to “style” it to match the blog’s overall look, but mostly to make it easy to use.
The JavaScript calculator does the work that the spreadsheet calculations were doing, and I wanted it to handle everything that had already been set up there: the RMD divisor calculation, the cash-sweep, the bucket-strategy-based withdrawal sequence, need calculation based on the RMD or an income shortfall, taxes, and accounting for the “widow penalty.”
I wanted the tool’s output to show key milestones like when each bucket gets depleted, when the portfolio might run short, and whether it survives to age 95 or longer (user preference), ideally with a summary table or chart to visualize the results. Again, I wasn’t sure that was possible, but it turns out that AI is pretty good at this stuff.
AI told me that this would be a significant undertaking, which made me chuckle. It’s all just basic math based on some set of inputs and assumptions—what’s the big deal? Yes, the model turned out pretty intricate, mostly because once the basic build was complete, I kept wanting to add a few more inputs or assumptions, plus an additional calculation or two.
Since I was learning what AI could do, I added things like pension income, QLACs, QCDs, and market shocks. The “biggie” was adding a monte-carlo simulation option, which I didn’t think would even be possible. It did that using what is called a “Box-Muller transform” to generate randomness in JavaScript, which is a little more elegant than averaging a few random numbers. It isn’t, however, anywhere near as sophisticated as the monte-carlo simulation that tools like the simulator on HonestMath.com use.
My main goal was to embed this improved tool on the blog, and it was easy to do when the AI created the self-contained HTML file with an embedded calculation engine that I could easily download and host on a page by embedding it in an “iframe,” which is simply an HTML element that embeds another webpage or external content within a parent webpage, creating a nested browsing environment.
But then I got another idea. What if I could make this a standalone website with its own URL, with the input form on one page and the results on another? I could also add an instructions page, some relevant articles, and other information. And so “retirementincomemodelingtool.com” was born.
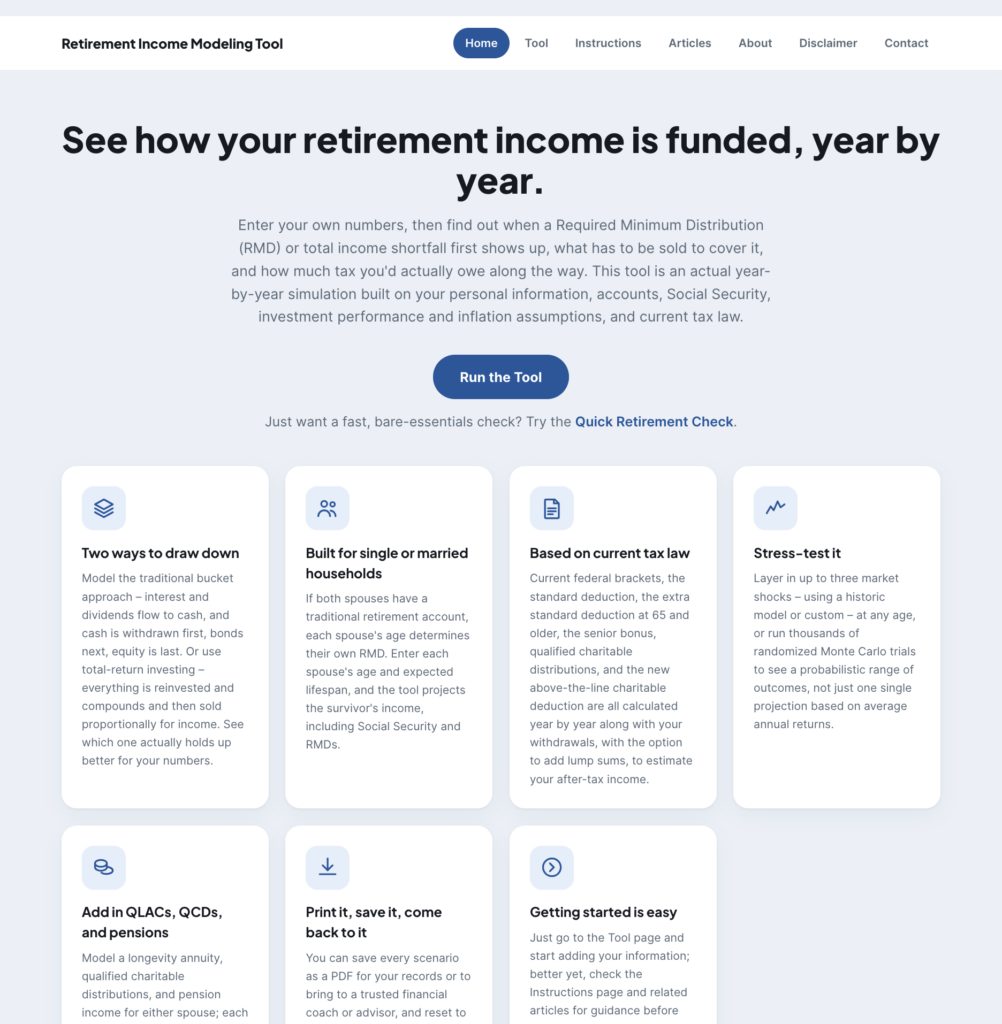
This took additional work with the AI to reformat the HTML pages so they could function as standalone pages. I also wrote the instructions page and the articles (repurposed from my blog and rewritten for this website) and had AI convert them to HTML. (Full disclosure: I wanted to make sure I covered all the bases, so I used AI to create an outline that I could expand on to write an instruction manual based on how AI built the input and results pages.) I set up free hosting on Cloudflare.com, which software developers often use to deploy and test new software. Then I tested and tweaked both the design and the backend calculation engine. Here’s a snapshot of the tool’s homepage:
The calculation engine
Once the inputs and assumptions are entered in the appropriate fields, the calculator, written by the AI in JavaScript, applies annual returns to each “bucket”—bonds get price returns (defaulting to zero unless there’s a “market shock year” when returns are abnormally low), TIPS accrue interest, equities get their price returns, and cash grows at the cash rate.
For shock events, it overrides all returns that year with the user-defined shock values. The input options let users specify when shocks occur (by age or year offset) and how long they last (one or two years, matching historical patterns like 2008 or 2022-2023).
The user interface includes two preset shock scenarios—2008-style crash, 2022-2023 stagflation, or custom values—plus magnitude overrides for each asset class and an input to set the shock start age. The input form has sections for household basics (current age, portfolio end age), starting balances across all five buckets, and income needs (annual amount and inflation rate).
I also added optional sections for Social Security (annual amount, survivor benefit based on IRS rules, optional predecease age), return assumptions with preset “Moderate” and “Conservative” buttons that auto-fill but remain editable, and a QLAC option with premium, payout rate, and income start age. I also added a QCD option that affects both RMD and tax calculations, plus options for lump-sum expenditures and tax increases or decreases based on tax-law changes.
The output will show whether the portfolio survives to the target age, plus key milestones like the first age of shortfall, when short-term bonds get tapped, and when core bonds are needed.
Is it secure?
The short answer is yes, and I want you to understand why, not just take my word for it. First and foremost, this tool never asks for any information that could be stolen and used against you, such as your name, account numbers, or Social Security number. Every field you fill in contains only dollar figures or simple numerics: your age, estimated lifespan, your balances, your spending, and what Social Security pays you. None of this information is as sensitive as a password or an account number. Even in the worst-case scenario where someone saw every number you entered, they wouldn’t be able to commit fraud with any of them.
There’s another good reason why it’s secure beyond what the form asks for. This tool runs entirely inside your browser. When you enter your figures and click “Run Simulation,” the calculation happens right there on your own personal device. Nothing is sent to a server or stored in a database, and I never see it. If you close the tab, the data is deleted unless your browser remembers it for your convenience the next time you visit (which it probably will unless you have a browser setting that prevents it). Even then, the data is stored only on your device, in your browser, not on any server or in any database I control. In fact, this application has no database.
The site also runs over an encrypted connection (indicated by the padlock in your browser’s address bar) and carries the standard security protections that modern browsers look for. There’s no login, password, or account to create, so there’s nothing to break into.
Finally, a “front door” security mechanism is also in place: a short list of rules that tells every visitor’s browser how to behave safely while it’s on the site. You could think of it like a set of house rules posted at the front door. These rules explicitly tell a visitor’s browser “here’s what’s allowed and what isn’t,” so the browser just uses its own generic defaults, some of which are more permissive than they need to be.
None of this replaces the need for you to take basic precautions, such as using a trusted device, as you would with any site, and other standard security procedures. But the straightforward answer to ‘Is it secure?’ is that very little here needs securing in the first place, and the Tool supports all the usual browser-related security mechanisms.
Putting it through its paces
Once the tool had almost everything I wanted, I started using it to model my own situation. I quickly realized the only way to ensure it was working correctly was to think through the logic, do the calculations manually, and then compare them with the tool’s output. I found a couple of issues, mainly because I added a feature or input variable without asking the AI to account for it elsewhere. Overall, it worked very well.
It’s relatively easy to check the accuracy of a modeling tool like this because, as earlier noted, it’s mostly a cascading series of mathematical calculations based on a set of inputs and assumptions. Things are more complicated “under the covers” of the Monte Carlo simulation, and frankly, I’m just trusting AI on that—I don’t have the time or ability to manually do the math.
I’ve spent quite a bit of time using it, and I think it’s time to release it to my subscribers as a “beta” version. I need others to use it and provide feedback on the user interface (input side) and the results (both aesthetics and accuracy). I’d be especially interested in any suggestions you might have for something I missed that really should be in a tool like this. But remember—this isn’t a “be all/do all” retirement planner; it focuses on modeling income and cash flows in retirement, particularly for those taking RMDs and perhaps using QCDs or QLACs, not the saving and investing side. It doesn’t include a Roth Conversion calculation, as I think that belongs in its own calculator, but the results would feed this model.
If you find all of this more than a little intimidating, there is a “lite” version of the tool called the “Quick Retirement Check.” It thins the Tool down to the bare essentials only: your account balances, your spending, your Social Security, and whether the money lasts. No pensions, no QLACs, no tax strategy, just a quick check. But if you want to model RMDs, QCDs, market shocks, or a survivor scenario specifically, you need to use the full version of the Tool instead.
Evergreening could be a challenge
In the calculation engine, a lot of current IRS data has to be accessible to run the RMD and tax calculations. That data is currently “static”; by that I mean that if tax laws change, I’ll have to update the data myself (which I can do with a simple text editor) or ask AI to do it. I asked AI if it could do that dynamically using what’s known as an “API” (Application Programming Interface), but as it turns out, the IRS doesn’t publish APIs for the public to access tax tables. Some companies sell that capability as a service, but of course I don’t want to subscribe to one. So, I’ll revisit this later in the year to see what I may need to do (or ask AI to do) to keep it current as we go into 2027.
The good stuff
I’ve already mentioned that the tool is live on Cloudflare as a standalone website, and the link is https://retirementincomemodelingtool.com. If you want to give it a spin, I would strongly urge you to read the instructions first. If any of the terminology is unfamiliar or confusing to you (such as RMDs, QCDs, QLACs, etc.), the site also has articles that provide an overview.
You could start simple with the “lite” version (https://retirementincomemodelingtool.com/lite) and go from there. And please feel free to reach out with any questions or issues you find. As mentioned earlier, this is a Beta version, a work in progress, so I really need user feedback.
Note: Check your email tomorrow for a link to my next post, an article that walks you through a case study using the Tool. Because the article includes many images of the tool itself, the email will link to the full article on the website rather than include the full text, as I normally do.