

I admit, I’m interested in AI. It’s probably because I spent almost all of my adult life working in information technology (IT), but also because AI may be one of the most significant technologies of my lifetime, next to the internet (without which AI would probably not exist).
Because of my interest, I’ve researched and written about AI, and like most people, I see a lot of promise and a lot of risk in what may be the most transformational technology development in history. Which way it goes—for much good or much evil— depends on many different things, which I can’t go into in this post. (For a quick read, I suggest this article on TGC: Christians Can Give Two Cheers for AI. For a more in-depth discussion, see: A Christian’s Perspective on Artificial Intelligence.)
Suffice it to say, technology companies have launched one of the biggest unregulated experiments of all time on the public, and it’s still in progress—we may not know the outcome for quite a few years.
In the meantime, I think AI can be useful, and I like to use it to do things for me that I either 1) am unable to do but AI does reliably well, or 2) I could do but just plain don’t want to do, which I call “donkey work.” You can use AI to evaluate or even design an investment portfolio, and I understand it’s gotten pretty good at that. You can ask it questions about IRS rules and finance, but sometimes it makes mistakes. You can use it to plan a trip, and it seems more than capable of handling that. You can even ask it theological questions, but I would be really careful there.
Beginnings
Over the years, I’ve written quite a bit about generating retirement income, the “bucket strategy,” Required Minimum Distributions (RMDs), Qualified Charitable Distributions (QCDs), taxes, and other related topics. I’ve used spreadsheets in various ways, both in the blog and in my books, to illustrate different things, but I’ve never used one that brings together nearly everything in one place to provide a holistic view of retirement income flows over an entire retirement.
So, I had an idea: why not develop One Big Beautiful Spreadsheet (OBBS) to do just that. And so it began.
I had also recently read an article by CPA Mike Piper, titled “What Is a Qualifying Longevity Annuity Contract (QLAC), and Who Should Buy One?” After an explanation, he said the following:
So the ideal candidate for a QLAC is a household that is concerned about longevity risk (i.e., they’re in good health and concerned about portfolio depletion in a long-life scenario), yet they’re anticipating spending less than their RMD every year and are not concerned about inflation risk. It’s hard to think of a set of life and financial circumstances that would cause a household to be in such a position.
I’m not shopping for a QLAC, and I don’t think I’m what Piper describes as the ”ideal candidate” for one (although you may be), but it did get me thinking about longevity risk. More in terms of my wife and what her financial situation would be if I were to predecease her in my 80s and she then lived well into her 90s—still with RMDs, with reduced Social Security benefits, and in a filing-single tax status with higher brackets.
I’ve written quite a bit about ”loving your widow,” and even though I’ve run some simulations using honestmath.com, I thought this might deserve a more in-depth analysis. An “OBBS” seemed to be just what I needed. That’s when I turned to AI for help.
As I’ve said, so far, I’ve mostly used AI for “donkey work”—an “always-on-call” digital assistant. I’m not a programmer, and I haven’t used it to write code. However, many IT shops are using it in a variety of ways. I occasionally use it for calculations, and it seems pretty capable. I also use it for research and occasionally for computer work like what I was considering: creating a fairly complex retirement modeling spreadsheet.
I don’t want AI to be my companion or my friend, my counselor, advisor, or pastor, and I don’t want it to do work for me that I should do myself, even if it can do it better than I can. (If I do, the work might be better, but it won’t be mine.) I just want a digital assistant that does what I ask. I recently read an article by Tim Challies about the use of AI by authors and bloggers, and I think I mostly align with his position on the creative side of things. As it relates to its usefulness for other things, I like what he wrote in another article titled Wise and Helpful Ways for Christians To Experiment With AI:
Whatever the case, having spent a good bit of time scratching the surface of AI’s capabilities, I am increasingly convinced that it is here to stay. That being the case, it may be worth your time to learn how it works, what it can do, and how it may make a positive difference in your life—and judge how it may make a negative one as well. For Christians, AI must remain a servant and never become a master. We need to evaluate it not only by whether it saves time or increases productivity, but by whether it helps or hinders us in loving God and serving our neighbor. Like so many of our latest and greatest technologies, we can be certain it will both bless and curse us, both give and take away, which means we must, as always, remain both wise and discerning.
An update
To catch you up, my basic retirement portfolio allocation hasn’t changed—it’s still in the 35/65 to 40/60 range (it fluctuates as I rarely rebalance), and I continue to use a version of the bucket strategy for retirement income that I wrote about earlier. However, some things have changed in recent years (I’ve written about most of them):
1) I became eligible to make QCDs at age 701/2 and have been making as full use of them as much as I can; and 2) I reached RMD age at 73, so I am now subject to the IRS drawdown schedule. (That’s important to note because the majority of our retirement savings are in a Traditional IRA.)
For this most recent checkpoint and analysis, I wanted to focus on longevity risk. I was thinking about the possibility (likelihood?) that my wife will outlive me, possibly to age 90 or beyond. As I’ve discussed in other articles, income and taxes change when one spouse passes away; most notably, the surviving spouse will be in a higher tax bracket, and some percentage of Social Security income will be lost. (This is sometimes referred to as “the widow penalty.“)
Taking this analysis a little further, if we couple those impacts with a potential market or economic event that reduces asset values, interest, and dividends, or all three, my wife’s financial situation could be even more negatively impacted. This is what professional retirement planners would describe as the combined impact of ”sequence risk” and ”longevity risk.”
The net result is that, based on how I manage our “bucket” strategy, we (or my wife) could exhaust our cash reserves and bonds and at some point have to start drawing from equities by selling shares. This isn’t necessarily a bad thing unless it gets to the point where the portfolio is exhausted and what’s left to live on is only Social Security. (I think we all, to varying degrees, would want to try to prevent that).
As I thought about this, I realized I have never really modeled such a situation specifically, although the monte-carol simulations that honestmath.com runs take into account almost every conceivable economic scenario to evaluate portfolio sustainability.
Honestmath.com is a really good single-portfolio simulator: income, expenses, an estimated return distribution, and a probability of success based on 10,000 trials. But unfortunately, it doesn’t have account-level granularity. It can’t differentiate an RMD from ordinary spending; it can’t exclude a QCD from an RMD calculation the way the actual rule works; and it can’t reduce Social Security at a specific age for a specific surviving spouse, which is exactly the scenario I want to analyze.
I could do two separate runs: one for us as a couple and then one for just one of us, but it still wouldn’t reflect the specific account-level mechanics I’m interested in.
Other options
I could probably use a more sophisticated, subscription-based retirement planner like MaxiFi, Boldin, or Projection Lab, but I didn’t want to pay an annual subscription fee. Plus, it would take a lot of time to figure out whether any of them would do exactly what I was trying to do. So, I decided to try a different approach—partly for fun and partly because I wanted a tool to do this. I started working on a spreadsheet to do the modeling and quickly realized it was beyond my ability (or desire) to complete, so I decided to see if I could use AI to do it for me.
I decided to try it with AI because, in my opinion, this is the kind of thing that AI can (and should) do very well. I wanted a spreadsheet to run some numbers based on a set of assumptions and different scenarios. So I used Anthropic/Claude/Sonnet 5 to build it. It did, but not without a few hiccups.
I had to give it very detailed instructions. I told it what calculations I wanted to perform, what assumptions I wanted to use, and the different scenarios I wanted to consider, and it did the “grunt work” for me. It’s amazingly helpful for things like that. Do I understand all of the different variables, inputs, relationships, and the basic math involved? Yes. Could I have built the spreadsheet myself? Yes, eventually—I have that skill, but it would have taken much longer. It was much faster to get AI to do it and then make sure it did what I wanted—and correctly—since I understood the underlying calculations and how Excel works.
So, yes, it saved me a ton of busywork, which is precisely what I think AI can do well. But even then, it’s always best to check its work, especially when multiple calculations are involved. And I found that if I asked it to change something, it would, but it didn’t think through what else would have to change as a result. So, with each revision, I had to manually check all the columns and formulas to make sure they were correct.
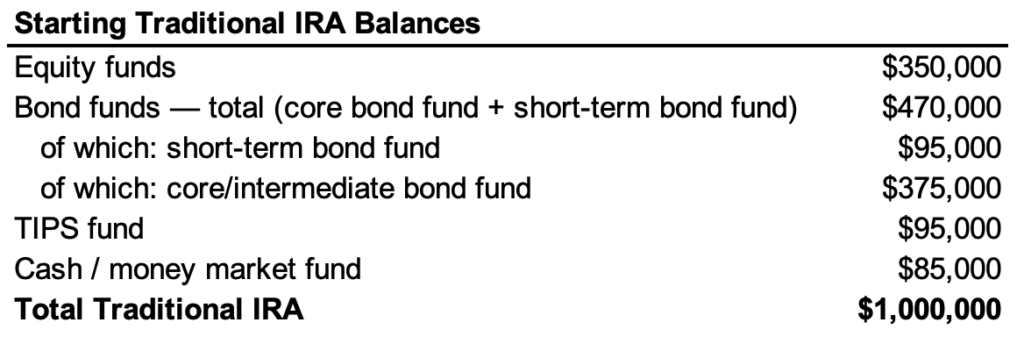
I first set it up with my personal data and ran a few scenarios. Then, for this article, I changed the assumptions to use illustrative round numbers throughout: a one-million-dollar portfolio split roughly a third into stocks and the rest into bonds and cash, which is a fairly ordinary conservative allocation for people my age (currently 73):
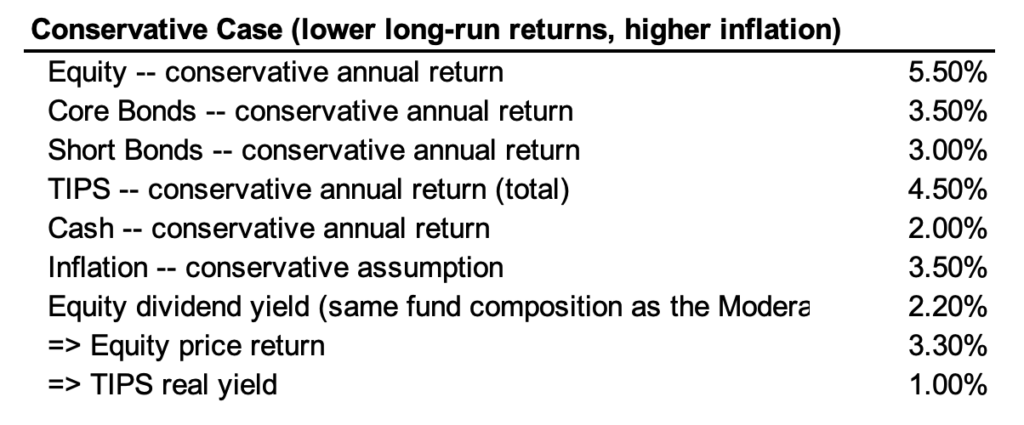
I used very conservative rate-of-return estimates and higher inflation, which allow for lower-than-normal returns over the long haul. This certainly isn’t a worst-case scenario, which would be more like a sustained 2008 event:
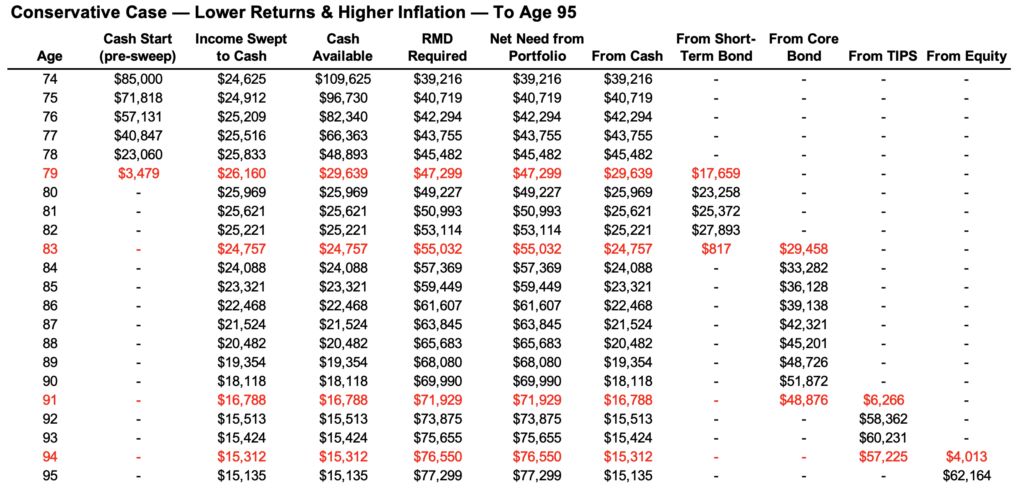
To start the analysis, I was only looking at RMDs and how the portfolio would fund them using the “bucket strategy.” (I’ll evaluate how well it handles total income needs, which brings Social Security into the picture, later on.)
The RMDs are based on standard IRS requirements, which, for this illustration, in 2026, at age 74, come to about $39,000/year for a portfolio of this size. In this portfolio, the cash account begins with $85,000 in bonds. The bond funds pay interest, and the dividend-paying stocks distribute dividends, and both are “swept” into the cash account (cash available).
Here are the most important things I observed in this example:
- The portfolio’s cash, dividends, and interest income can fund the RMDs until age 79. At that time, the original cash balance is exhausted, and money must also be drawn from the short-term bond fund (which is precisely how a “bucket strategy” is supposed to work).
- This continues until age 83, when core bonds must be tapped, and then TIPS at age 91; some equity assets must be sold to meet the RMD of $76,299 at age 94. It’s not shown, but at that time, the portfolio’s equity balance is $670,000. (You may recall that the beginning equity balance was $350,000.)
You can see that, with this portfolio and conservative return assumptions, income alone from interest and dividends isn’t sufficient to cover the RMDs except for the first five years or so. If interest rates and dividend payouts are higher, it would cover them for longer.
This is how the bucket strategy is intended to work; it involves drawing income from other assets in a predetermined sequence when interest and dividend income alone are no longer sufficient to fund the RMDs. I ran this same analysis on my personal portfolio and found a similar pattern.
Total income
So far, I’ve only looked at RMDs and funded them with income and withdrawals from the Traditional IRA. We haven’t introduced Social Security into the equation because I can’t use it to meet RMDs instead of drawing from the IRA. However, Social Security plays a big role in total income over our lifetimes.
I’ll do this analysis assuming the primary Social Security beneficiary passes away at age 85, and the surviving spouse lives at least to age 95. When that happens, the income situation changes significantly, most notably with a 33% reduction in Social Security benefits (if the surviving spouse was receiving spousal benefits; it would be higher if they were receiving a full benefit).
A bucket strategy—the strategy to “fill the gap”—would also apply to my wife as a survivor in order to meet her annual income needs. In the illustration, I assume starting combined Social Security benefits of $45,000 and an annual income need of $70,000. I didn’t reduce required income starting at age 85 due to so many of the unknowns at that point in life, but it could be less after one spouse passes away.
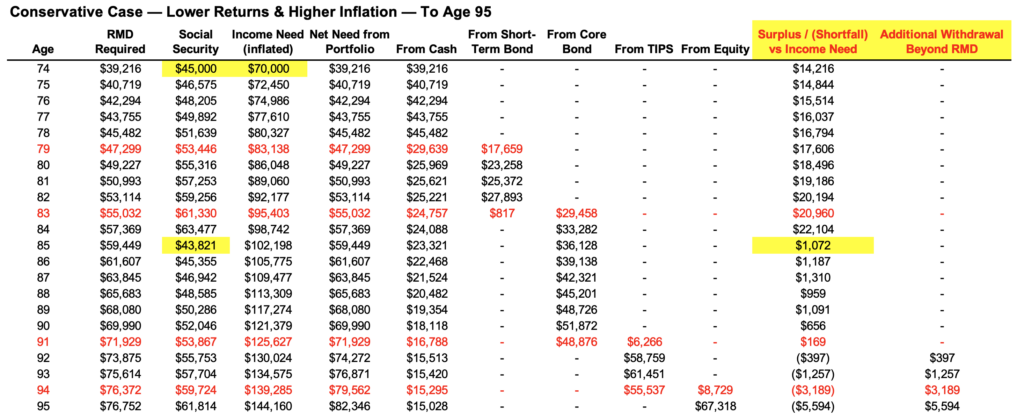
In this scenario, we see a familiar pattern in terms of funding RMDs. And Social Security, along with the RMDs, meets the income need, with a yearly surplus, until age 92. However, the surplus starts to fall when Social Security benefits are lower starting at age 85.
Furthermore, at age 95, the equity portion of the portfolio is at $636,094, very close to what it was when we looked at RMD funding only earlier.
A reasonable conclusion, based on a very conservative scenario, is that this portfolio will last to age 95 and beyond, apart from some kind of highly disruptive black swan event.
Looking at my personal situation, I saw very similar results; my wife didn’t have to start liquidating equity until age 95, and of course they had grown considerably.
A worse market environment
Most of us have been around long enough to know that “stuff happens.” So I was curious what would happen in a scenario similar to 2022-2023 if it occurred during years 7 and 8 (at age 81 and 82).
This was not a 2008-type event, with stocks down roughly forty percent, bonds falling at the same time, and a slow, grinding recovery over the next decade. My assumptions were more modest—equity: -18.11%, bonds: -13.01%, and TIPS: -11.85%. (This is the kind of thing that a monte-carlo analysis would have randomly factored in to estimate portfolio survival probabilities.)
Even then, though there’s a shortfall beginning at age 85, equity isn’t tapped until age 92, and the equity fund balance is $475,372 at age 95. So, even with a “shock” (not worst case, of course), it still holds up pretty well.
But what about a 2008-style event? I modeled a “2008-2009-type event” in years 2 and 3 at age 75-76. This is a classic “sequence of returns” issue on steroids:
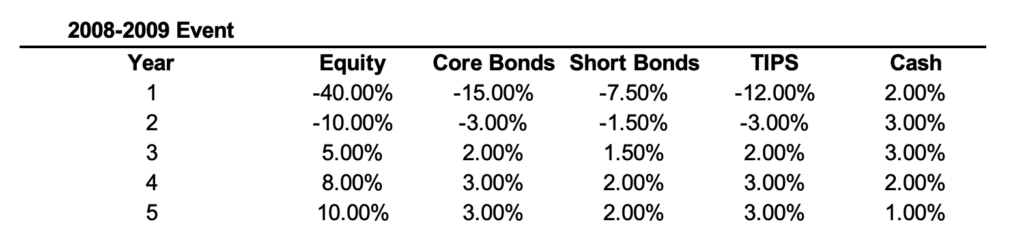
After year 5 (age 79), returns reverted to “normal” levels.
The results of this were surprising. The portfolio held up pretty well. Income remained in surplus until age 85; no stock funds were sold until age 93, and the total equity balance was still $370,880 at age 95.
This spreadsheet model can only predict how well a portfolio will hold up over a couple of decades under a specific set of circumstances. You probably see the problem—we have no way of knowing whether such a set of circumstances will actually occur, since many (but not all) of the inputs, variables, and relationships between them are only somewhat knowable and mostly unpredictable.
The model helps us understand the handful of relationships that drove each result we saw under different conditions. (This is why monte-carlo simulations can be helpful; they can run thousands of possibilities and come up with a range of probabilities for likely outcomes.)
Here are the key things I think we can take from this:
- The size of the portfolio withdrawal we take each year drives outcomes. It is always the larger of the RMD or the income we need minus Social Security. Early in retirement, real spending needs almost always exceed RMD, so spending drives withdrawals. But RMD’s required percentage climbs every single year purely from the IRS divisor shrinking, nothing to do with markets, while a spending need only grows with inflation. Eventually, RMD crosses over and becomes the larger number, often forcing you to withdraw and pay tax on more than you actually need to live on. Which side of that crossover you’re on in any given year determines almost everything else about how sensitive that year is to other assumptions.
- The ratio of income needed to portfolio size matters more than almost anything else. A $50,000 need against $1,000,000 is a 5% initial draw; $100,000 against the same portfolio is 10%. (To be fair, if that’s your total income need, then Social Security will contribute some of it, as we saw in the model—see #3.) Still, before investments and return assumptions, you have to get the spending number right, since everything else depends on it.
- Social Security benefits relative to the total income needed determine how much of any potential shortfall from the portfolio gets covered automatically. Since Social Security and the income needed both grow with inflation, if Social Security covers a large share of the need, the net gap stays small, and RMD usually handles it. We saw this in the model over many years. If Social Security covers only a small share, the dollar gap grows every year and is far more exposed to anything that further reduces Social Security, like the transition to survivor status.
- Almost any potential shock can be a non-event or a real problem, depending on how much flexibility already existed. The loss of 33.3% of the Social Security benefit did not significantly impact the outcome when RMD showed a surplus versus income. A change to any single input rarely matters in isolation; it matters in relation to how much margin existed with others.
- Sequence matters as much as magnitude. The same market event injected in year one versus year seven produced different outcomes because, by year seven, the portfolio had already absorbed six years of normal withdrawals and had less flexibility left to take a hit. An early market decline and an identical event later don’t have the same effect.
- Withdrawal order affects compounding. Withdrawing from cash and short-term holdings first isn’t just about not selling equities; it’s about giving the growth assets more years to compound. That’s why equity so often didn’t get tapped until very late in the game (mid 90s), as long as fixed income was large enough to cover the need.
- Moderately more favorable return assumptions will have a positive but disproportionate impact due to compounding over two decades. Moving the model from conservative to more moderate returns using the same shock-and-recovery structure, without changing anything else, would increase the ending equity balance by roughly a third. A one- or two-point difference in assumed annual return looks small on paper but works its magic by year twenty.
- Introducing guaranteed income (such as a QLAC or bond ladder) makes the most sense when you doubt you’ll have the funds to make necessary withdrawals. The longer RMD plus Social Security meets your income needs, the less likely you’ll need additional forms of guaranteed income. Plus, any money not used to purchase an annuity or invest in a bond ladder can keep generating investment income. However, if a gap shows up early in the analysis and grows quickly, perhaps due to a significant and prolonged market event or a big increase in spending, serious consideration should be given to these products, as these are precisely the type of things they are intended to deal with.
Your situation
If you want to get a general idea of where you stand, the main thing to do is to figure out whether you have a gap or not. You can do a quick checkpoint by adding up what your portfolio’s interest and dividends generate in a normal year, then comparing that to your RMD. If it’s very tight, then what you have in cash and short-term bonds will probably carry you through many years once your RMDs exceed interest and dividend income.
It’s always a good idea to ask yourself whether you need additional guaranteed income. You can get it for no other reason than to improve your “sleep at night” factor. But it’s best to ask what income it’s actually replacing or providing. If your Social Security and portfolio withdrawals already cover most of what you spend, a guaranteed payment on top of an RMD you were taking anyway won’t necessarily help much. You need to understand whether it would close a known or anticipated gap, provide additional peace of mind (or both), or neither.
My philosophy hasn’t changed much since I retired eight years ago: hold a sensible, boring mix of stocks and bonds in low-cost ETFs and mutual funds, keep enough on hand that you’re never forced to sell at the wrong time, and resist the temptation to add more complexity than needed.
But it also makes sense to check in once in a while to see whether my approach still makes sense for me. That’s why I built the spreadsheet and tested it in a couple of different ways. As we’ve seen, it held up both times. I’d encourage you to find out whether yours does too, before you build or buy something you don’t need.
A better tool
The spreadsheet works well, though it may be inelegant. So I got another idea. I know AI can write code, and I only know a little HTML and CSS, so I asked it to convert the spreadsheet into an “online calculator” or an “app” I could embed on a page on this blog. I told AI I envision something like a simple input form (questionnaire) I could edit that looks a lot like the spreadsheet’s assumptions page. And then it would produce a result; perhaps not all the rows and columns, but key info, like when the gap first shows, surplus or not, when certain funds have to be tapped, and how long the portfolio would last. I would want a user to be able to introduce certain market “shock” events at any time.
As I expected, it responded that it could. So, I set out to build it. Part Two will tell you more about that work and the result. I won’t keep you in suspense; AI did write the code, and after a lot of back and forth, the addition of more options and assumptions, and multiple edits and iterations, I have a pretty good tool which I think is a little unique in that it focuses on retirement income modeling, using either the “bucket strategy” or more of a “total return strategy,” with a specific foucus on RMDs, QCDs, taxes, and how specific retirement investments are slowly liquidated over time.
I call the tool a “beta version” because, although I have worked with it quite a bit, no one else has used it, which is essential to “fleshing out” inconsistencies, errors, or documentation that needs correction.
A caution
This article, and the tool I am referring to, get “in the weeds” on modeling and analyzing retirement income. I think this is a productive exercise, but retirees can also “obsess” a little about their income, how long it will last, how well their investments perform, etc. If you use the tool, it may give you the result you were hoping for, or it may not. That’s where we have to stop and examine our hearts.
Paul wrote to Timothy that godliness with contentment is great gain, adding that if we have food and covering, that’s enough (1 Tim. 6:6-8). I don’t think that verse is about retirement portfolios, obviously, but I do think it describes a heart attitude worth bringing to this whole exercise.
Contentment isn’t passivity, nor is it becoming over-confident or over-anxious. Planning as best we can is wise stewardship, and this tool will help you model your income in good years and bad. But once the testing is done and you understand the results, keep in mind that it is just a model and can never reflect the final reality, whatever it may be. That’s where trust in our Heavenly Father comes in, and from that trust will flow contentment.
Coming Tomorrow: I Used AI to Build a Retirement Income Modeling Tool—Beta Version (Part Two)