A sustainable withdrawal rate is integral to a wise retiree’s financial stewardship plan. Your withdrawal rate determines how much money you’ll take from your retirement savings to add to other sources of income to meet your spending needs.
I became aware of a video of one of Dave’s recent shows in which he discussed retiree portfolio withdrawal rates with a young caller. (You can watch the original video here—start at the 1:13:50 mark.)
It caused a big dust-up on social media because Dave suggested that a 3% to 5% rate is much too small and that withdrawals of 8% would be better. He based that on an assumption of annual returns of 12% and inflation of 4%.
As you might imagine, some financial professionals consider his claims unsupportable. But his math is elementary:
Withdrawal Rate = (Avg. Return – Avg. Inflation)
Doing the math we get: (12% – 4%) = 8%
According to Dave, the math works, and your portfolio is never depleted because, every year, there’s always 8% remaining for withdrawal after inflation. And the portfolio value remains stable (and may even grow if returns are higher or inflation is lower).
So what about this? Is Dave right, or is his suggested withdrawal rate dangerously high? Perhaps he’s just being overly optimistic about future stock market returns. Or inflation. Or maybe you can withdraw eight percent!
It’s not impossible
As my readers know, I am a fan of Dave Ramsey, having attended (and taught) Financial Peace University and his biblical principles of budgeting, saving, giving, and avoiding debt. I am also a trained Ramsey Solutions Financial Coach. Therefore, I’m not one to take casual potshots at Dave or his teachings.
That said, some things about the video concerned me, not just the content.
In it, he uses what I consider to be some overly harsh words to describe those who disagree with him because they anticipate lower stock returns and recommend lower (“safer”) withdrawal rates. He probably did it as more of a ”showman” for entertainment value than anything else; I doubt he intended to insult anyone. Still, I’d rather he didn’t do it.
Let your speech always be gracious, seasoned with salt, so that you may know how you ought to answer each person. (Col. 4:6)
Since I’ve previously written that I don’t condone all of his advice about investing for retirement, you won’t be surprised if I express some concerns about Dave’s 8% “safe” withdrawal rate.
But before I do, I want to say where I think Dave may be coming from. Remember, Dave looks at everything relative to the overall planning framework he teaches, known as the “Baby Steps” to Financial Peace.
Suppose someone followed Dave’s overall plan precisely for a lifetime (i.e., having no debt, saving 15% of income, investing early in a predominantly or all-stock mutual fund portfolio, and not retiring before Medicare and Social Security kick-in). In that case, they might have enough savings such that an 8% withdrawal rate would last 20 or 30 years.
I checked my assumption with the retirement calculator on the Ramsey Solutions website:

As you can see, a young saver who starts investing $500/month ($6,000/yr.) at age 25, earns 12% compounded annually, and retires at age 67 will have a nest egg of about $ 7.5 Mil.! There can be little doubt that such a large savings balance would support an 8% withdrawal rate in retirement, at least for 10 or 15 years, even if it earned nothing during that time.
$7.5 Mil. x .08 = $560K/yr (in today’s dollars; not adjusted for inflation)
$7.5 Mil. ÷ $560K per year = 13.3 years
Another thing that could make such a high withdrawal rate at least minimally defensible is a very short (10 to 20 years) planning horizon. Someone who retires later, say in their mid-70s, or who has severe health issues may be okay with a much higher withdrawal rate.
Plus, a retiree with a longer horizon starting with an optimistically high withdrawal rate is not ‘wrong,’ especially if they make downward adjustments later as circumstances warrant. These reductions can happen intentionally (in response to changing economic and market conditions) or unintentionally as they become less active as they age.
For example, some retirees could start with a relatively high withdrawal rate of 6 to 8% and then reduce it to 3 to 4% later on and, depending on other factors, possibly end up just fine. If they’ve kept their spending in check and paid off their debt, as Dave recommends, this could be a relatively easy adjustment.
Finally, there’s another option that doesn’t fit with Dave’s overall approach (in fact, he would not approve of it) but may enable withdrawals close to 8%.
A couple could use 60% of their portfolio to purchase an immediate income annuity, which would, at age 66, payout approximately 6.5% based on some quick numbers I ran on immediateannuities.com. They would invest the remaining 40% in an aggressive portfolio of stocks or stock funds and withdraw 7% to 8% from it.
This would result in a withdrawal rate in the 7% range, which is very close to Dave’s target of 8%. Although 40% of the portfolio would be at risk, even if the stock portion failed sooner than expected, the annuity would continue to pay.
So, yes, 8% is certainly an initial spending level that many financial professionals would consider too high (too much risk of early portfolio depletion). But it may not be as bad as some suggest since retirees can have widely different circumstances, and as they change, they can (and do) reduce their spending throughout retirement.
Many folks will get to retirement and realize they’re not as well prepared as they thought. (If you believe you’re one of them, may I suggest my recent book, Redeeming Retirement, A Practical Guide to Catch Up.) They’ll realize that the traditional “safe” withdrawal rate of 4% will not supply them with enough income. Therefore, they may need to increase their withdrawals to 6 or 8% to make ends meet.
If this is the real world for you, it doesn’t matter what anyone says about Dave’s advice. You’ll have to withdraw more or reduce your expenses; it’s that simple.
If you start at 8%, you may be able to reduce that over time, depending on your spending and how your portfolio performs over that same time. Plus, you may fare even better if you have some guaranteed income from Social Security and/or a pension (many will).
Order of returns matters
Dave’s 8 percent withdrawal rate is based on simple math: the stock markets earn 12% annually, and inflation is 4%, so you can spend the difference. This equation implies a 12% annual average return, but the problem is that nobody receives that average yearly.
Dave’s math works perfectly if we all receive precisely 12% nominal (not inflation-adjusted) returns each year with exactly 4% inflation. But if you’ve checked your portfolio’s performance for the last few years or bought a car or groceries, you know that’s not how the real world works; returns and inflation are not constants.
Things get a lot more complicated once we inject market returns’ variability (aka, volatility) into the equation. And remember—I’m focusing on the returns during retirement, not in the 30 years leading up to it when the arithmetic average return for the S&P500 was about 11.8%, and the geometric average (mean) return was closer to 10%.
This variability of market returns over time and its potential impact on retirees is known as the “sequence of returns risk.” This risk exists whenever we spend (withdraw) periodically from a volatile portfolio. And because Dave suggests we invest in a diversified, all-stock portfolio, the potential for volatility is very high year-to-year (daily and monthly).
If the withdrawals are made by selling stocks each year, let’s say for 25 years, the problem is that today, we have no idea what the selling price will be for each of those 25 withdrawals. It’s the uncertainty of future selling prices that creates sequence risk.
An excellent way to understand sequence risk is to consider what happens when there is none. Any 25 years of stock market returns will, for example, be the same at the end of that period regardless of the order of those returns.
Consider five years of portfolio returns of 10%, 6%, -7%, -4%, and 12%. These equate to 1.1, 1.06, 0.93, 0.96, and 1.12 growth rates, respectively. Multiply those in any order, and we get a three-year growth factor of 1.17. So, a dollar at the start of the five years is worth $1.17 after five years, an average annual return of 8.5%.
No matter what order you receive the returns (or multiply them) for this short period, the result is the same (8.5%). The sequence of the returns doesn’t matter.
But when you withdraw 8% a year (presumably adjusted each year for inflation), the order of the sequence does matter. A poor sequence of returns, defined as a series of very low or negative returns early in a long period of retirement, combined with high spending, can lead to early portfolio depletion, and a good sequence of returns decreases the probability of depletion despite the same average return over the period.
The high cost of sequence risk is the loss of compound investment returns. In a year of negative returns, we lose money. If we withdraw from our portfolio during that year, we ‘lose’ even more.
For example, if our portfolio balance is $500,000 and we withdraw 8%, it will fall to $460,000. If it loses 8%, it will fall even further to $423,200. If we withdraw 8% at the beginning of the following year, our portfolio balance will be $389,344, down 21% from its starting balance.
Exacerbating things is that it would take returns of 28% to get back to $500,000.
When we spend from a volatile portfolio and lose money during a down-market year, our portfolio also loses the potential future compounded gains on the amount we lost and withdrew. This is why it takes longer for a retirement portfolio to recover from a bear market than for an accumulation (saving only) portfolio before retirement.
We just don’t know
In practice, we could assume an average annual return of 12% and use it in a retirement calculator, an inflation estimate, and our withdrawal rate. But the reality is that we have no control over the sequence of returns we receive, nor can we predict the sequence.
Neither do mutual fund managers who do their best to beat the market during good market years and minimize their losses during bad ones.
Nor do we know what future inflation or stock market (or stock mutual fund) returns will be.
Dave’s assumption of 4% inflation may be a little high, but it’s not totally unreasonable. So the crux of Dave’s argument for an 8% ”safe” withdrawal rate relies on consistent stock market returns of 12% per year—a big assumption, for sure, but not impossible, especially for shorter periods.
Based on this compilation by Honest Math, financial professionals don’t expect stock market returns to be as high in the next few decades as they have in the past. Economists have similar expectations.

I’m pretty sure Dave knows that neither the markets nor stock mutual fund managers deliver annual returns of precisely 12% annually. A few stock mutual funds have averaged 12% a year. And the S&P 500 has averaged about 10% yearly, the geometric average, or “mean.”
The 12% that Dave comes up with is the arithmetic average, which is not the actual return that an investor who holds an S&P500 Index fund will receive. Why? The arithmetic average return is the return on investment calculated by adding the returns for all years and dividing it by the total number of years. It overstates the actual return and is only appropriate for shorter periods.
Stocks have increased about 10% yearly (the geometric average), not 12% yearly. 12% is the arithmetic (or simple) average, not the actual return investors realize. Also, relatively few retirees keep their entire portfolio in stocks for the entire duration of retirement, so even a 10% return assumption is probably way too aggressive (doing so would also subject them to a massive amount of sequence risk).
Modeling can help
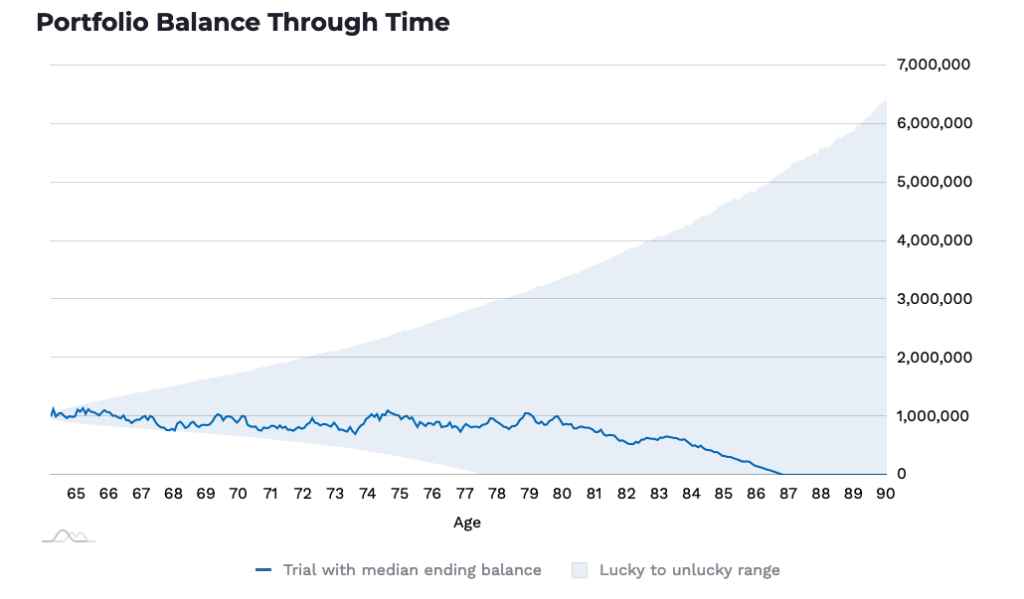
I like the (free) sophisticated but simple-to-use retirement simulation modeling tool that the guys at honestmath.com have developed. So, I used it to model a $ 1 Mil. stock-only portfolio’s performance over a 30-year retirement. The Honest Math tool uses a default future average stock market performance of 8%, which is very reasonable. But I changed it to 12% to use Dave’s assumption.
I also used Dave’s estimate for inflation of 4%. (It is for the portfolio only, with no other income and assuming an 18% tax bracket.)
The model uses Monte Carlo simulation (not backtesting based on historical market performance data), and each simulation uses 10,000 trials to come up with the blue line, which represents the journey of the single portfolio that ranked at the 50th percentile (media) to the end of the investment period. (Each time you run the model, the blue line will change, but the percentiles and ending balances remain “materially the same.”)
The shaded area is bounded by the 20th percentile (lower) and 80th percentile (upper) portfolio values at every age (detailed in the table below). As Honest Math explains,
Generally speaking, if at least 80% of your trials end with a positive portfolio balance, we’d consider you to be in good shape. Although this implies that as many as 1 out of 5 trials would fail in retirement, that’s not actually the case. And even if it were, not all “failure” scenarios are created equally.


As you can see, the portfolio holds up surprisingly well—better than I would have expected. However, 80% of the trials did not end up with a positive balance. It lasts until age 87 based on the median (geometric average) at the 50th percentile. However, 50% of the outcomes are below the median, and at the 20th percentile, the portfolio is depleted by age 77.
Note that this “unlucky” outcome is based on a respectable return of 7.58%. But the “lucky” scenario at the 80th percentile ends up with a whopping $5.92 million, a return of 14% per year instead of 12%! (Also, remember that I included taxes in this model.)
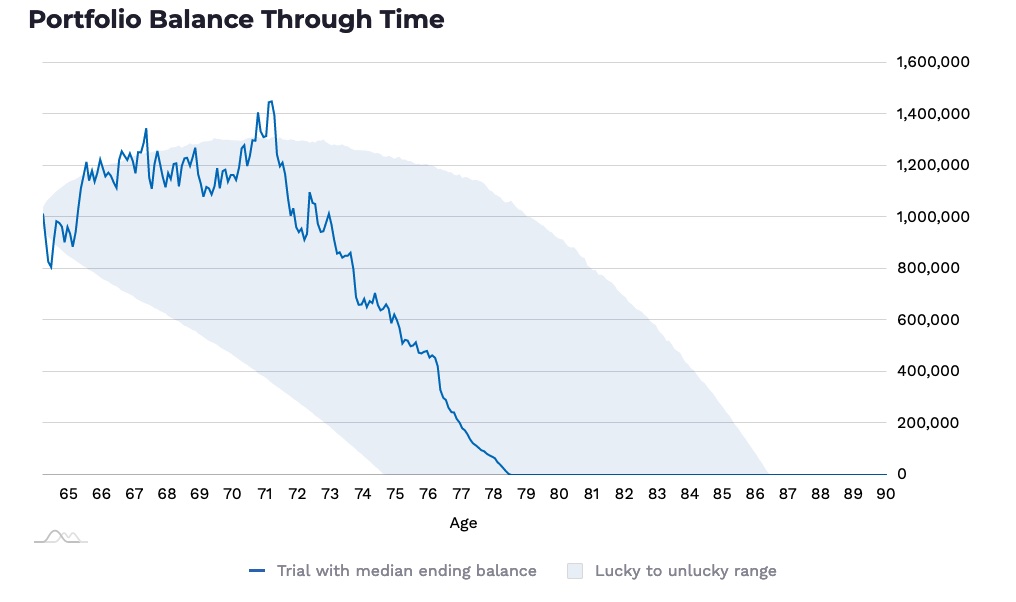
So, what if we re-run the model using Honest Math’s 8% future returns assumption and keep all the other assumptions (withdrawal rate of 8%, inflation of 4%, taxes of 18%)?


Ouch! As you can see, at the 50th percentile, the portfolio is depleted by age 79 at the 80th percentile, and the ”unlucky” age is 75 (the 20th percentile). As this is a more likely scenario regarding future stock market returns, this model run offers the best estimate of how long a portfolio you withdraw 8% annually from is expected to last.
Conclusion
As we’ve seen, it’s theoretically possible that Dave’s withdrawal strategy would work in some unique individual situations in a very narrow set of personal (micro) and global (macro) economic conditions. If you decide to do it, you’ll need a very high risk tolerance to keep a 100% stock portfolio for a lifetime and a low aversion to possibly outliving your financial assets.
Since Dave assumes you may not receive Social Security, I didn’t include it in any simulations. If you do (and most probably will), it can help with a higher withdrawal rate. You’ll have that to fall back on, even if your portfolio goes to zero. Some can live on Social Security alone, but most would have a lot of difficulty.
If you decide to follow Dave’s advice, understand the risks: sequence of returns risk, increased longevity, and relying too much on historical stock market returns.
It would also be wise to have a contingency plan, such as annually reevaluating your withdrawal rate based on market performance and spending or occasionally moving some money into less risky assets.
The prudent sees danger and hides himself, but the simple go on and suffer for it (Prov. 27:12)

